Import data
Load libraries and function
A specific function for circular averaging the wind direction is
necessary to summarise these data. This function will be loaded from
./R/circular_averaging.R after loading the necessary
libraries.
library("tidyverse")
library("here")
library("geometry")

# load circular.averaging()
source(here("./R/circular_averaging.R"))
Import compiled dataset from local files.
Spore count data
Import spore trap data and inspect.
spore_data <- read_csv(
  here("data/spore_data.csv"),
  col_types = list(field = col_factor(),
                   trap_coord = col_factor())
)
Summarise the spore data into the total number of spores collected in
each field at each time slice at each trap by combining the traps’
samples and sub-subsamples. We’ll keep the field col to
join the weather data and the trap_coord col here for
joining with another data frame that has the cardinal directions in it
for further analysis.
spore_data <-
  spore_data %>%
  group_by(field, trap_coord, distance_m, time_min) %>%
  summarise(n_spore = sum(n_spore))

spore_data
## # A tibble: 288 × 5
## # Groups: field, trap_coord, distance_m [96]
## field trap_coord distance_m time_min n_spore
## <fct> <fct> <dbl> <dbl> <dbl>
## 1 1 N 100 90 2
## 2 1 N 100 180 4
## 3 1 N 100 270 3
## 4 1 N 200 90 2
## 5 1 N 200 180 3
## 6 1 N 200 270 14
## 7 1 N 300 90 1
## 8 1 N 300 180 0
## 9 1 N 300 270 0
## 10 1 N 400 90 1
## # ℹ 278 more rowsWeather data
Import weather data, filter unused data, convert from kilometers per hour to meters per second and inspect the resulting data.
meteo_data <- read_csv(here("data/wind.csv"),
                       col_types = list(field = col_factor()))

# some sites go past 270 minutes, remove those data.
meteo_data <-
  meteo_data %>%
  filter(minute_lap <= 270) %>%
  mutate(wind_speed = wind_speed * 0.2777778)

meteo_data
## # A tibble: 330 × 6
## field minute_lap rel_hum temp wind_speed wind_dir
## <fct> <dbl> <dbl> <dbl> <dbl> <chr>
## 1 1 0 65 16 1.72 E
## 2 1 5 65 16 2.50 E
## 3 1 10 65 16 1.58 E
## 4 1 15 65 16.2 1.72 E
## 5 1 20 65 16.2 1.64 E
## 6 1 25 65 16.2 1.58 E
## 7 1 30 65 19.5 1.64 E
## 8 1 35 65 19.5 0.611 E
## 9 1 40 65 19.5 1.17 E
## 10 1 45 65 19.7 0.333 NE
## # ℹ 320 more rowsData prep for analysis
Add cardinal directions
We need to convert cardinal directions to degrees for plotting and modeling purposes (adapted from Adam’s code for chickpea ascochyta blight spore dispersal).
coord_deg <- tibble(
  dir = c(
    "N",
    "NNE",
    "NE",
    "ENE",
    "E",
    "ESE",
    "SE",
    "SSE",
    "S",
    "SSW",
    "SW",
    "WSW",
    "W",
    "WNW",
    "NW",
    "NNW"
  ),
  degrees = seq(0, 337.5 , by = 22.5),
)
Create a spore_data object that has spore and trap
degrees (location as a cardinal direction).
spore_data <-
  spore_data %>%
  left_join(coord_deg, by = c("trap_coord" = "dir")) %>%
  rename(trap_degrees = degrees)
Create a meteo_data object that has the wind direction
in degrees.
meteo_data <-
  meteo_data %>%
  left_join(coord_deg, by = c("wind_dir" = "dir")) %>%
  rename(wind_degrees = degrees)
Summarise the weather data into 90, 180 and 270 minute interval bins
The weather data are summarised from 0 to 90, 0 to 180 and 0 to 270 minutes to align with the spore trapping data.
This is where the circular.averaging() is needed since
we cannot simply take the mean value of wind direction in
degrees here.
m <-
  meteo_data %>%
  mutate(time_slice =
           case_when(
             minute_lap <= 90 ~ 90,
             minute_lap > 90 & minute_lap <= 180 ~ 180,
             TRUE ~ 270
           ))

m
## # A tibble: 330 × 8
## field minute_lap rel_hum temp wind_speed wind_dir wind_degrees time_slice
## <fct> <dbl> <dbl> <dbl> <dbl> <chr> <dbl> <dbl>
## 1 1 0 65 16 1.72 E 90 90
## 2 1 5 65 16 2.50 E 90 90
## 3 1 10 65 16 1.58 E 90 90
## 4 1 15 65 16.2 1.72 E 90 90
## 5 1 20 65 16.2 1.64 E 90 90
## 6 1 25 65 16.2 1.58 E 90 90
## 7 1 30 65 19.5 1.64 E 90 90
## 8 1 35 65 19.5 0.611 E 90 90
## 9 1 40 65 19.5 1.17 E 90 90
## 10 1 45 65 19.7 0.333 NE 45 90
## # ℹ 320 more rowsrh_90 <-
m %>%
filter(time_slice == 90) %>%
group_by(field) %>%
summarise(rh = mean(rel_hum))
rh_180 <-
m %>%
filter(time_slice == 90 | time_slice == 180) %>%
group_by(field) %>%
summarise(rh = mean(rel_hum))
rh_270 <-
m %>%
group_by(field) %>%
summarise(rh = mean(rel_hum))
rh <-
bind_rows(list(
"90" = rh_90,
"180" = rh_180,
"270" = rh_270
), .id = "time_slice")temp_90 <-
m %>%
filter(time_slice == 90) %>%
group_by(field) %>%
summarise(temp = mean(temp))
temp_180 <-
m %>%
filter(time_slice == 90 | time_slice == 180) %>%
group_by(field) %>%
summarise(temp = mean(temp))
temp_270 <-
m %>%
group_by(field) %>%
summarise(temp = mean(temp))
temp <-
bind_rows(list(
"90" = temp_90,
"180" = temp_180,
"270" = temp_270
), .id = "time_slice")wind_speed_90 <-
m %>%
filter(time_slice == 90) %>%
group_by(field) %>%
summarise(wind_speed = mean(wind_speed))
wind_speed_180 <-
m %>%
filter(time_slice == 0 | time_slice == 180) %>%
group_by(field) %>%
summarise(wind_speed = mean(wind_speed))
wind_speed_270 <-
m %>%
group_by(field) %>%
summarise(wind_speed = mean(wind_speed))
wind_speed <-
bind_rows(list(
"90" = wind_speed_90,
"180" = wind_speed_180,
"270" = wind_speed_270
),
.id = "time_slice")meteo_data <- m %>%
mutate(time_slice = 270) %>%
rbind(mutate(filter(., minute_lap <= 180), time_slice = 180)) %>%
rbind(mutate(filter(., minute_lap <= 90), time_slice = 90)) %>%
group_by(field, time_slice) %>%
summarize(
rh = mean(rel_hum),
temp = mean(temp),
wind_speed = mean(wind_speed),
wind_degrees = circular.averaging(wind_degrees)
)Merge the spore data with the weather data
Use left_join to merge the raw spore data,
spore_raw and weather data, meteo_data on
field and time_slice/time_min.
Then add columns for the x and y locations on a Cartesian grid of the
traps.
mod_dat <- left_join(meteo_data,
                     spore_data,
                     by = c("field" = "field",
                            "time_slice" = "time_min")) %>%
  mutate(degree_dif = trap_degrees - wind_degrees) %>%
  mutate(time_slice = as.integer(time_slice))
Create Cartesian coords
# note that degrees need to be converted to radians for theta
xy <- data.frame(pol2cart(
  theta = mod_dat$trap_degrees * 0.01745329,
  r = mod_dat$distance_m
))

mod_dat <- bind_cols(mod_dat, xy)
coords_df <- mod_dat %>%
ungroup() %>%
distinct(trap_degrees, distance_m, x, y) %>%
mutate_at(vars(x, y), list(~ round(., 1))) %>%
arrange(trap_degrees)
coords_df %>%
ggplot() +
aes(x = y, y = x) +
geom_point() +
geom_text(aes(
label = paste0(trap_degrees, ",", distance_m),
vjust = 1
)) +
geom_hline(yintercept = 0) +
geom_vline(xintercept = 0) +
coord_equal()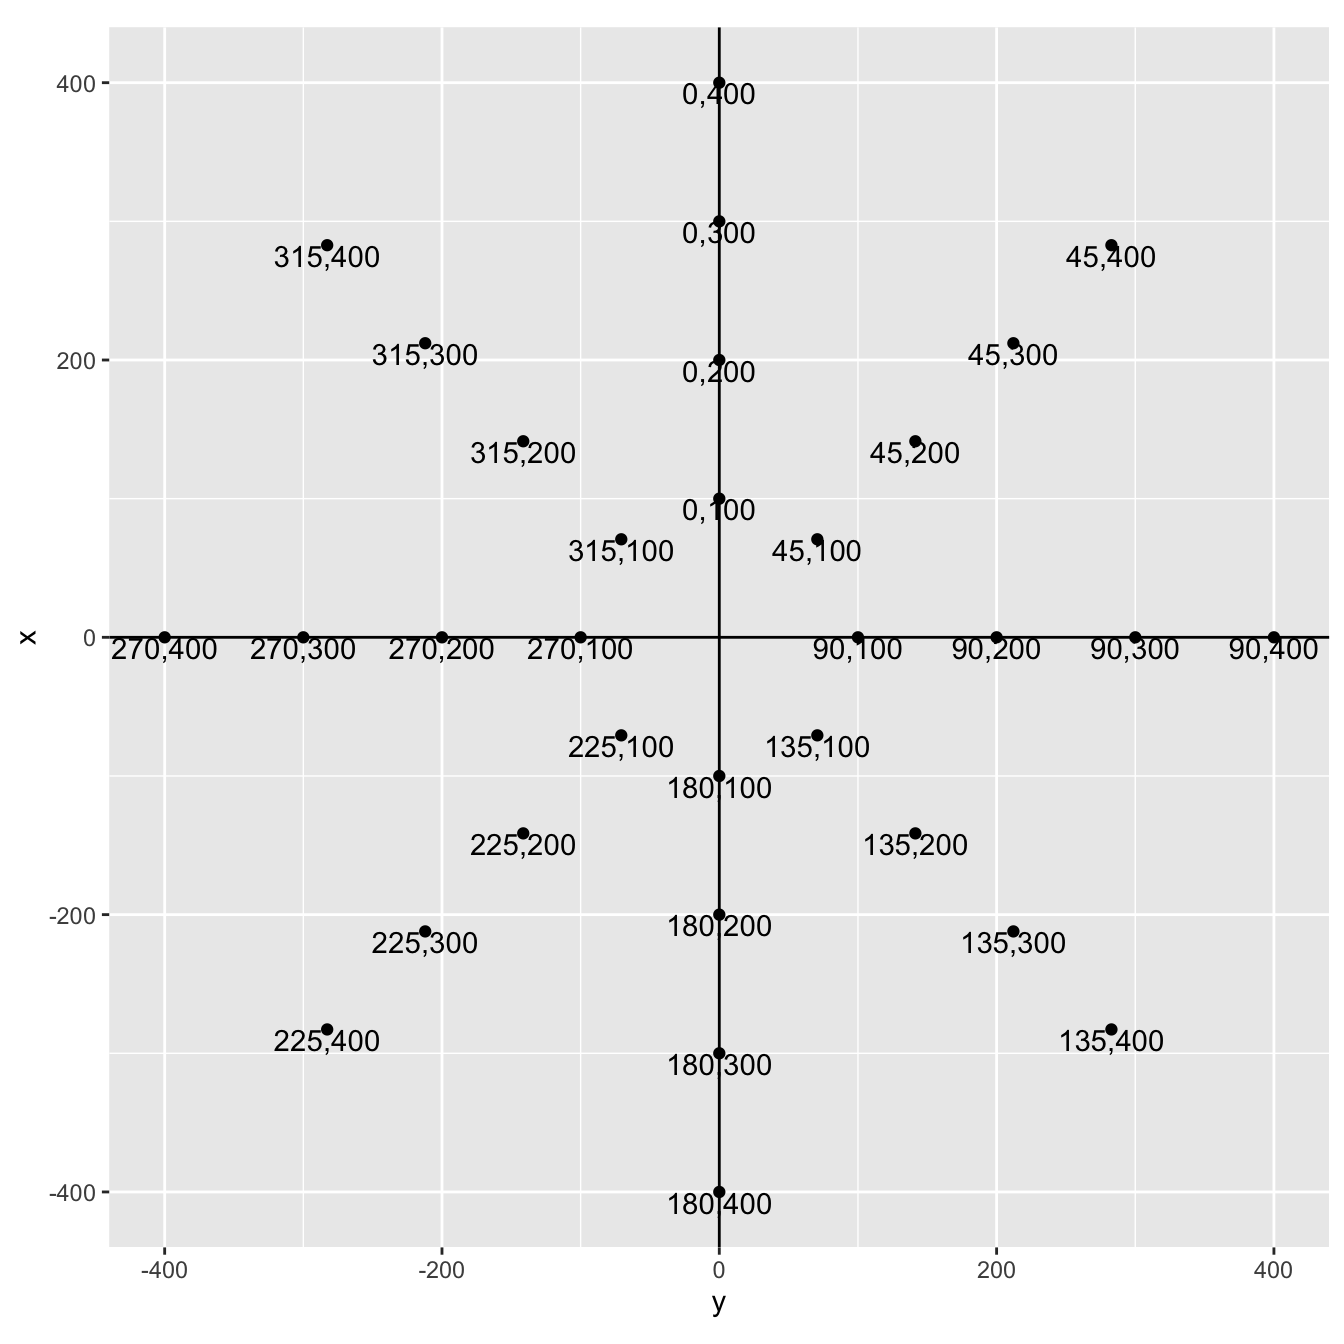
Save data object for fitting models.
save(mod_dat, file = here("data/mod_dat.Rdata"))

save(m, file = here("data/meteo_data.Rdata"))